

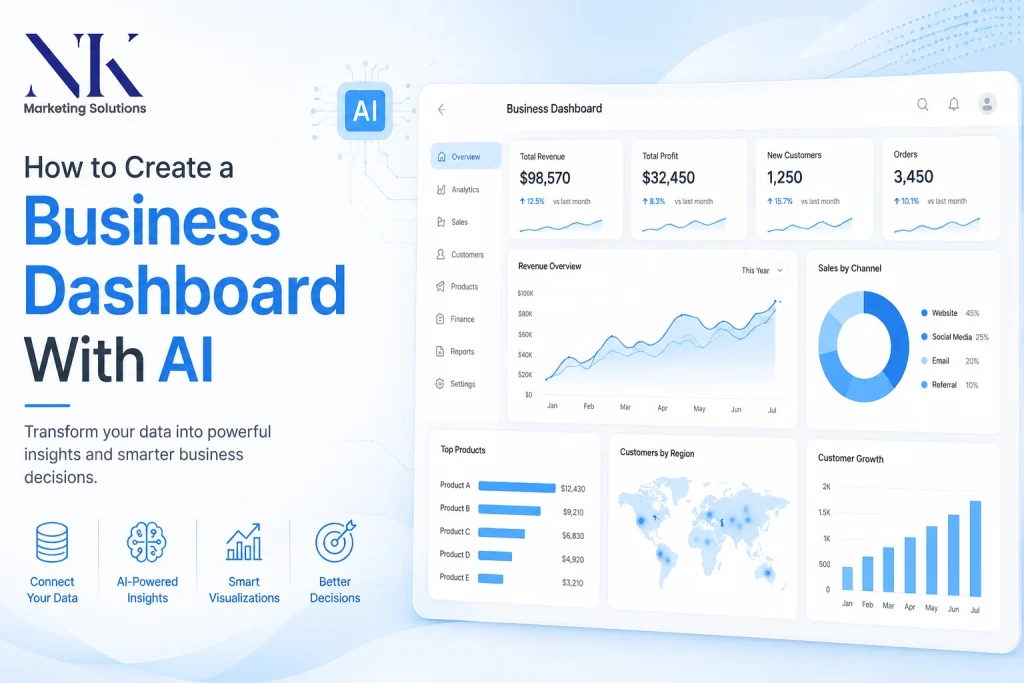
Most guides on this topic walk you through the same loop: connect your data, let the AI build some charts, tweak it with natural language, done in five minutes. That part is true, and we’ll cover it. But it skips the questions that actually determine whether the dashboard survives past week two — what happens to your data once you upload it, which of the three very different “AI dashboard” categories you’re actually choosing between, and how you catch it when the AI’s summary is confidently wrong.
This guide covers the full build, plus the parts most tutorials leave out: a decision framework for picking the right type of tool, a data security checklist, ready-to-use prompts by department, the mistakes that quietly break dashboards after launch, and realistic cost expectations for 2026.
Quick answer: To create a business dashboard with AI, pick a tool based on how often your data changes and how sensitive it is, connect two or three of your most reliable data sources, prompt the AI for a first draft, then manually verify the numbers and insights before anyone else sees it. The build takes minutes. Getting it trustworthy takes a few hours.
At NK Marketing Solutions, this is exactly the kind of reporting system we build for clients as part of our SEO, PPC, and email marketing work the mistakes covered below are ones we’ve actually run into, not a generic list.
Table of Contents
What “AI Dashboard” Actually Means (It’s Not One Thing)
People use the phrase to describe three different products, and mixing them up is the single biggest source of disappointment.
Conversational AI plus a spreadsheet. You paste data into ChatGPT, Claude, or Copilot in Excel and ask it to build charts or summarize trends. Free or nearly free, zero setup, but nothing refreshes automatically and there’s no live connection to your CRM or accounting software.
AI dashboard generators. Tools like the ones from thebricks, ML Clever, or ChartGen AI let you upload a CSV or Excel file and get a polished, presentation-ready dashboard with AI-written commentary in a couple of minutes. Great for one-off reports and small business use, though most work from a static file rather than a live database.
AI-native or AI-layered business intelligence. This is Power BI with Copilot, Tableau with its Agent and Pulse features, Looker running on Gemini, plus newer AI-first entrants like ThoughtSpot’s Spotter, Dot, and Bruin. These connect directly to your live data warehouse, respect governed metric definitions, and let you ask follow-up questions in plain English. More setup, real ongoing value for teams that check numbers weekly.
Which one you need depends on your data volume, whether the dashboard needs to refresh itself, and whether one person or fifty people will look at it. That’s the first decision to make, before you open any tool.
Where an AI marketing dashboard fits into this
If you’re a small business owner, the version of this you’ll actually use is an AI marketing dashboard one view that pulls together SEO performance, PPC campaign spend, email marketing metrics, and content marketing traffic, instead of logging into four separate platforms every Monday. That’s a narrower job than a general business dashboard, and it’s the one most owners are actually trying to solve when they search for this.
The good news is it’s also the easiest version to build, because the data sources are predictable: Google Ads, Google Analytics, your email platform, and a rank tracker. The steps below apply either way, but keep this narrower use case in mind if marketing performance is really what you’re after.
Before You Build: Three Decisions That Save You a Rebuild Later
Decision 1: Static report or living dashboard?
If you’re building something for a Monday meeting once a quarter, a generator that works off an exported spreadsheet is faster and cheaper. If people need to check numbers daily and the underlying data changes constantly, you need a tool with a live connection — otherwise you’ll be re-uploading files every morning, which defeats the point of automating this in the first place.
Decision 2: How sensitive is the data?
Customer PII, financial records, and anything under a compliance regime (HIPAA, SOC 2, GDPR) changes which tools are even on the table. Some AI dashboard generators send your file to a third-party model for processing. Enterprise BI tools with AI features generally process data within your existing security perimeter. We’ll go deeper on this below, but decide this before you pick a tool, not after you’ve already uploaded something you shouldn’t have.
Decision 3: Who reads it, and how often?
A dashboard for yourself can tolerate rough edges. A dashboard your CEO opens every Monday needs consistent formatting, correct labels, and numbers that match what finance already reported — because the fastest way to lose trust in an AI-built dashboard is for someone to spot a number that contradicts what they already know.
Step-by-Step: Building a Business Dashboard With AI
Step 1: Audit your data before you touch a tool
List where your important numbers actually live. For most small businesses that’s some mix of a CRM, Google Ads or another paid platform, Google Analytics, an email tool, accounting software, and spreadsheets someone updates by hand. Pick two or three sources to start with. Trying to connect everything on day one is the most common reason these projects stall before they ship.
Also do a quick sanity check on data quality. Duplicate customer records, inconsistent date formats, and mismatched currency symbols will get baked into the AI’s summary and quietly skew every insight it generates. Clean this up first; it’s less work than fixing it after the fact.
Step 2: Pick the AI approach that matches your decisions above
Match your earlier answers to a tool category:
- Occasional reports, low sensitivity: a spreadsheet-based generator or ChatGPT/Copilot working directly on an exported file.
- Live, recurring dashboard, moderate team size: Power BI with Copilot if you’re already in the Microsoft ecosystem, or Looker if your data sits in BigQuery.
- Larger team, need for natural-language Q&A on top of governed metrics: Tableau’s newer AI features, ThoughtSpot, Dot, or Bruin.
Don’t pick based on a “best of 2026” list alone — test the free tier or trial against your actual messy data, not the tool’s demo dataset. Demo data is always clean. Yours isn’t.
One thing worth checking first: if you already work with an agency handling your marketing, a chunk of this reporting may already exist in a shared dashboard you’ve just never asked to see. It’s worth a five-minute email before you spend a weekend rebuilding something that’s sitting in a folder already.
Step 3: Connect or upload the data
For file-based tools, export a clean CSV or Excel sheet with clear column headers — “Revenue” not “Rev_Q_Total_v2.” For connected tools, set up the data source integration one at a time, starting with whichever source is most reliable, and confirm the numbers match a report you already trust before adding a second source.
Step 4: Prompt the AI for a first draft
This is where specificity pays off. A vague prompt gets a generic dashboard. Tell the AI the decision the dashboard needs to support, the time period, and which metrics matter most:
“Build a sales dashboard showing monthly revenue trend, revenue by region, top 10 customers by order value, and average deal size. Flag any month where revenue dropped more than 10% versus the prior month.”
Expect to get roughly 80% of the way there on the first pass. That’s normal — the AI doesn’t know your business context yet, and the next two steps are where you supply it.
Step 5: Stress-test the AI’s output before you trust it
This is the step most guides skip entirely, and it’s the one that matters most. AI-generated dashboard commentary can state a trend confidently and still be wrong — it might mislabel a seasonal dip as a decline, miscount a metric because of a duplicate row, or attribute a spike to the wrong campaign because two things happened to move at once.
Before you share the dashboard with anyone else, run this check:
- Pick three numbers on the dashboard and manually verify them against the source system.
- Read every AI-written insight and ask: does this explanation actually follow from the data, or is it a plausible-sounding guess?
- Check date ranges and time zones — a startlingly common source of “wrong” numbers that are actually just measuring a different window than you expected.
- If the AI claims causation (“revenue grew because of X”), treat it as a hypothesis to investigate, not a fact to repeat in a meeting.
Step 6: Refine the layout and add your own context
Use natural-language edits to adjust what most tools now support conversationally — “make the revenue chart a line chart instead of bars,” “group these four widgets under a Marketing header,” “add a comparison to last year.” Then add the context only you have: why a number moved, what decision it’s meant to inform, what’s expected to change next quarter. AI can describe what happened in the data; it can’t tell your team what to do about it.
Step 7: Decide who sees what, and how often
Set up automated refresh schedules and alerts for the thresholds that actually matter (e.g., notify the team if churn crosses a set percentage) rather than alerting on every fluctuation, which trains people to ignore the notifications. Decide who gets the full dashboard versus a summary view — an executive usually wants five numbers and a one-line explanation, not the same twenty widgets an analyst uses.
Step 8: Put someone in charge of keeping it accurate
A dashboard that nobody owns drifts out of date within a quarter. Assign one person to review the metric definitions periodically, confirm new data sources are still connected correctly, and retire widgets nobody looks at anymore. Larger BI tools handle this with a “semantic layer” a central definition of what “revenue” or “active customer” means so the AI can’t quietly redefine your metrics differently each time someone asks a new question. If you’re on a lighter-weight tool without that concept, keep a plain document listing exactly how each metric is calculated, and update it whenever the calculation changes.
Data Privacy and Security Checklist Before You Upload Anything
This is the part most “how-to” content glosses over, and it matters more with every AI dashboard tool that processes data through a third-party model.
- Check whether the tool sends your data to an external LLM for processing, or processes it within your own environment. Read the specific data-handling policy, not just the marketing page.
- Confirm whether the vendor trains its models on your uploaded data by default, and opt out if that setting exists and you don’t want it on.
- Strip or mask personally identifiable information (names, emails, SSNs, account numbers) before uploading to any tool that isn’t already covered by your company’s existing data processing agreement.
- For regulated industries, verify SOC 2, HIPAA, or GDPR compliance claims directly with the vendor’s security documentation rather than assuming a popular tool automatically covers your requirements.
- Set access permissions on the finished dashboard the same way you would any other business report — AI-generated doesn’t mean lower stakes.
Prompt Templates by Department
Generic prompts get generic dashboards. These are starting points, written to be edited with your own metric names.
Sales
“Create a dashboard tracking monthly recurring revenue, new deals closed, average sales cycle length, and win rate by lead source. Highlight any rep whose close rate dropped more than 15% month over month.”
Marketing
“Build a dashboard showing cost per lead by channel, conversion rate from lead to opportunity, and campaign spend versus pipeline generated. Flag channels where cost per lead increased while conversion rate fell.”
If you’re building the narrower AI marketing dashboard version, break this out further: PPC spend and ROAS, organic traffic and keyword rankings from SEO, open and click-through rates from email campaigns, and sessions or leads from content marketing or website traffic. Four widgets, one screen, no logging into four platforms every Monday.
Finance
“Show monthly cash flow, burn rate, runway in months at current spend, and expenses broken down by category. Compare actuals to budget for the current quarter.”
Operations
“Track order fulfillment time, on-time delivery rate, and support ticket volume by category. Flag any week where average resolution time exceeded 48 hours.”
Mistakes That Quietly Wreck AI Dashboards
Treating the first draft as the final version. The AI’s initial output is a starting point built without knowledge of your business context, not a finished product ready to present.
Connecting every data source on day one. More sources means more places for something to break silently, and no one notices until the numbers stop making sense.
Letting the AI define metrics instead of your team. If “active customer” means something specific at your company, tell the tool explicitly — otherwise it will apply a generic definition that may not match what finance or leadership already uses.
No verification step. Publishing an AI-written insight without checking it against the source data is how a wrong number ends up in a board deck.
Alert fatigue. Setting notifications for every small fluctuation trains people to ignore all of them, including the ones that matter.
No owner after launch. Dashboards that nobody maintains slowly drift out of sync with how the business actually tracks its numbers.
What This Actually Costs
Pricing shifts constantly, so treat these as ballpark ranges rather than quotes:
- Free / near-free: ChatGPT, Claude, or Copilot working directly on a spreadsheet export. No live connection, no automated refresh.
- $20–$100/month per user: Dedicated AI dashboard generators and prosumer BI tools with AI features. Good fit for small businesses and single teams.
- Several hundred to several thousand dollars a month: Enterprise BI platforms (Power BI, Tableau, Looker, ThoughtSpot) with AI layered on top, usually priced per seat with add-on costs for the AI features specifically.
The honest tradeoff: cheaper tools save setup time but cost you manual re-uploading later. Expensive tools cost more upfront and in setup time but save that same time every single week once they’re running. Weigh that against how often the dashboard actually gets checked.
Frequently Asked Questions
Can I build a business dashboard using only ChatGPT? Yes, for a one-time or occasional report. Paste in a CSV export or describe your data and ask for specific charts and a summary. It won’t refresh automatically or connect live to your other systems, so it’s better suited to periodic reports than a daily-use dashboard.
Do I need to know how to code? No. Every category of tool covered here — spreadsheet-based AI, dedicated generators, and modern BI platforms — is built around natural-language prompts and no-code connections. Coding helps if you need a highly custom integration, but it isn’t required to get a working dashboard live.
Which tool is best for a small business? Start with a spreadsheet-based generator or a lower-cost prosumer tool rather than an enterprise BI platform. The enterprise tools are built for teams managing dozens of data sources and users; a small business usually needs two or three connected sources and a handful of viewers, which the lighter tools handle well at a fraction of the cost.
How long does it actually take? The first draft can come together in minutes once your data is clean and connected. Getting to a dashboard you’d actually present to your team — verified numbers, correct labels, sensible layout — realistically takes a few hours spread across the steps above, mostly in validation and refinement rather than the initial generation.
Can an AI dashboard replace a data analyst? It replaces a lot of the manual chart-building and first-pass summarizing. It doesn’t replace someone who understands why a number moved, catches when the AI’s explanation doesn’t hold up, or decides what the business should actually do about a trend. Think of it as removing the busywork, not the judgment.
Should I build this myself, or have my marketing agency handle it? If your only goal is tracking SEO, PPC, email, and content performance in one place, it’s often faster to ask whoever already runs those campaigns — the data is usually already sitting in their reporting tools. Build it yourself if you want full control or you’re tracking things outside of marketing, like sales or finance data.
Want This Built For You?
If reading through eight steps and a security checklist sounds like more time than you want to spend on reporting, that’s exactly the kind of thing we set up for clients as part of our ongoing marketing services at NK Marketing Solutions. Book a free consultation and we’ll show you what a working dashboard for your business would actually look like, no obligation.